Hourly to Salary Chart

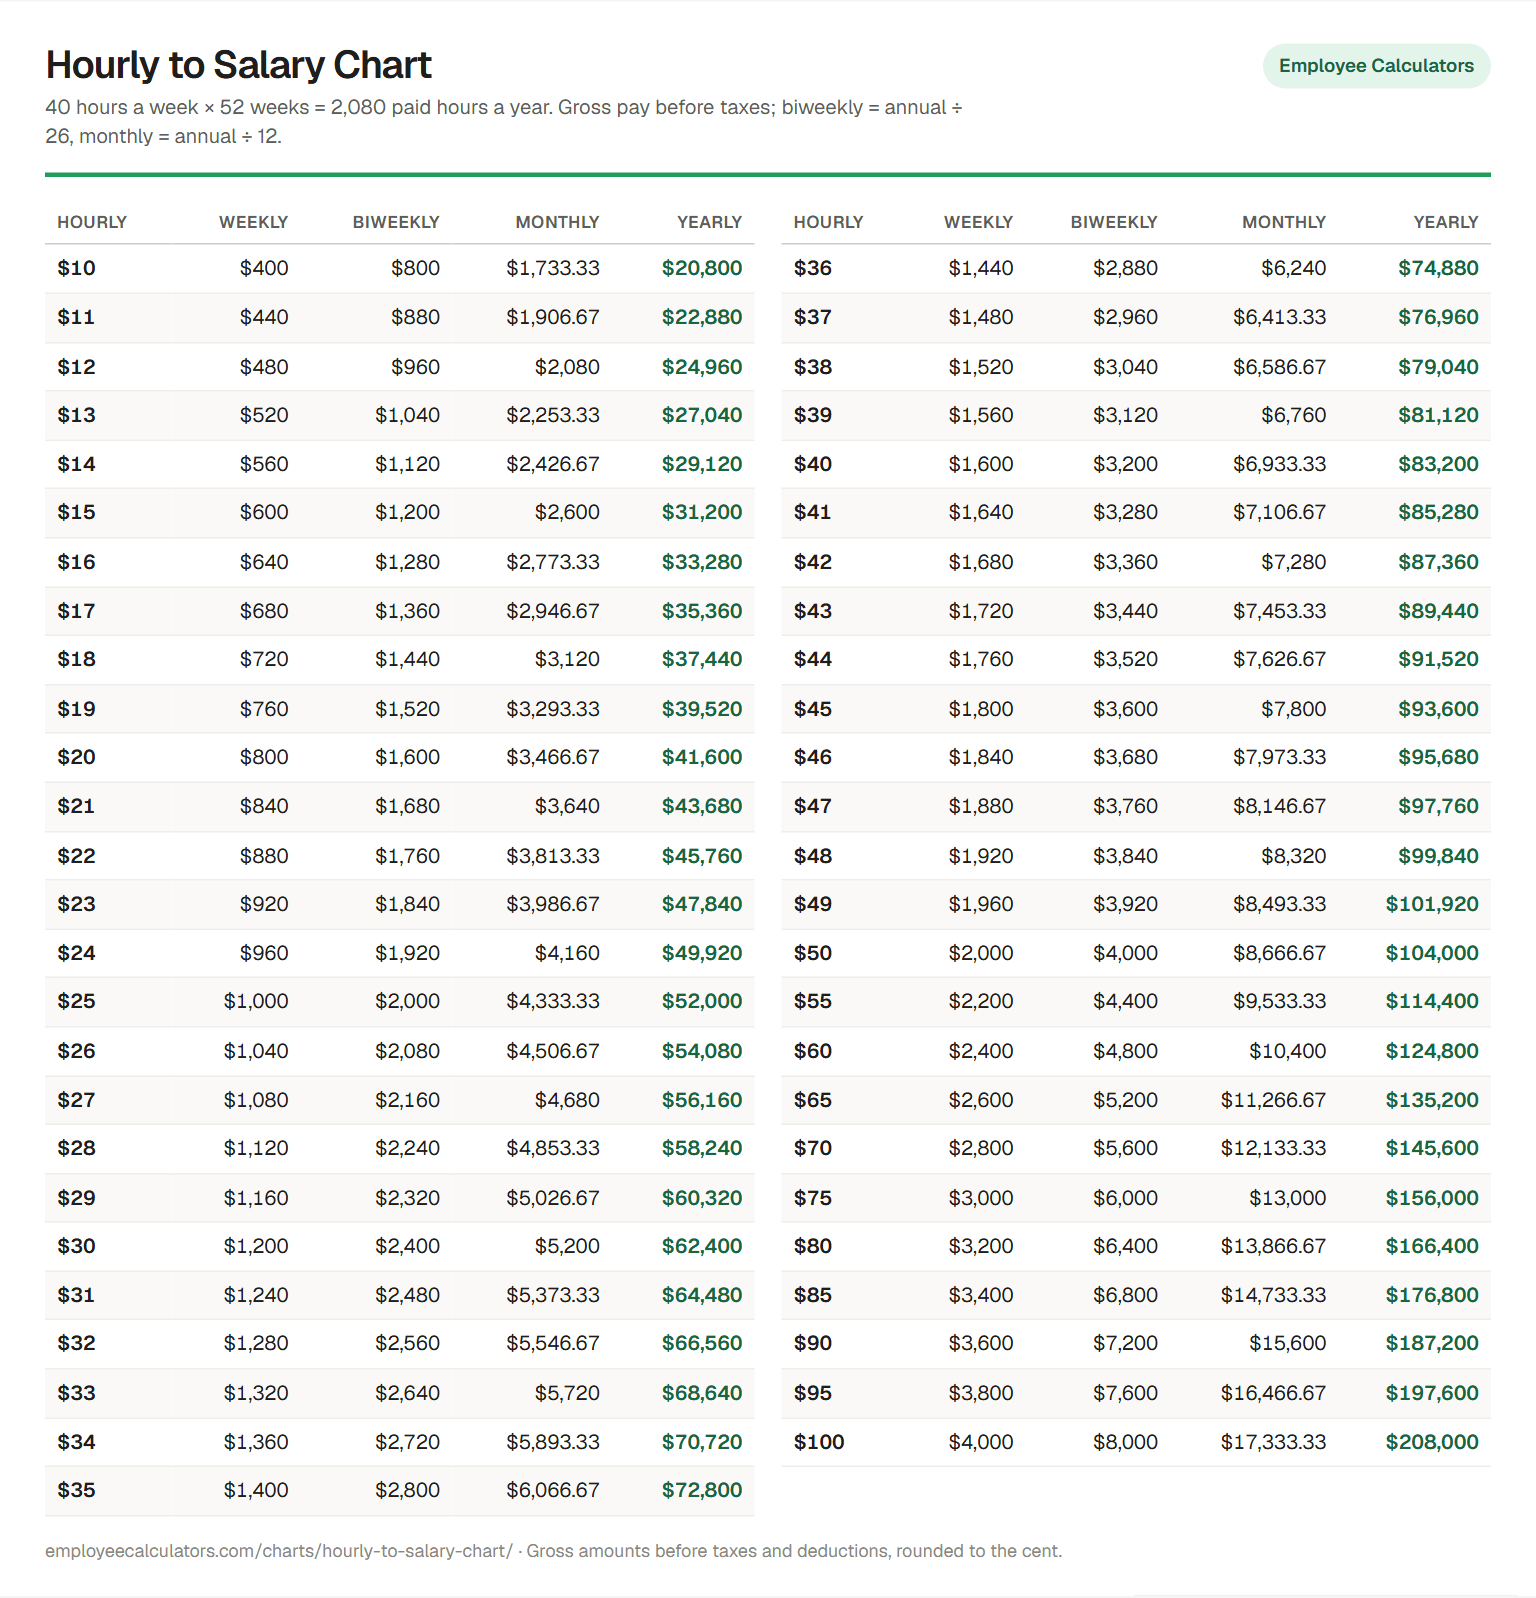
Hourly wages from $10 to $100 converted to weekly, biweekly, monthly, and yearly gross pay for a full-time schedule. Print it, save it as a PDF, or download the image.

Hourly to Salary Chart

40 hours a week × 52 weeks = 2,080 paid hours a year. Gross pay before taxes; biweekly = annual ÷ 26, monthly = annual ÷ 12.

Employee Calculators
HourlyWeeklyBiweeklyMonthlyYearly
$10$400$800$1,733.33$20,800
$11$440$880$1,906.67$22,880
$12$480$960$2,080$24,960
$13$520$1,040$2,253.33$27,040
$14$560$1,120$2,426.67$29,120
$15$600$1,200$2,600$31,200
$16$640$1,280$2,773.33$33,280
$17$680$1,360$2,946.67$35,360
$18$720$1,440$3,120$37,440
$19$760$1,520$3,293.33$39,520
$20$800$1,600$3,466.67$41,600
$21$840$1,680$3,640$43,680
$22$880$1,760$3,813.33$45,760
$23$920$1,840$3,986.67$47,840
$24$960$1,920$4,160$49,920
$25$1,000$2,000$4,333.33$52,000
$26$1,040$2,080$4,506.67$54,080
$27$1,080$2,160$4,680$56,160
$28$1,120$2,240$4,853.33$58,240
$29$1,160$2,320$5,026.67$60,320
$30$1,200$2,400$5,200$62,400
$31$1,240$2,480$5,373.33$64,480
$32$1,280$2,560$5,546.67$66,560
$33$1,320$2,640$5,720$68,640
$34$1,360$2,720$5,893.33$70,720
$35$1,400$2,800$6,066.67$72,800
HourlyWeeklyBiweeklyMonthlyYearly
$36$1,440$2,880$6,240$74,880
$37$1,480$2,960$6,413.33$76,960
$38$1,520$3,040$6,586.67$79,040
$39$1,560$3,120$6,760$81,120
$40$1,600$3,200$6,933.33$83,200
$41$1,640$3,280$7,106.67$85,280
$42$1,680$3,360$7,280$87,360
$43$1,720$3,440$7,453.33$89,440
$44$1,760$3,520$7,626.67$91,520
$45$1,800$3,600$7,800$93,600
$46$1,840$3,680$7,973.33$95,680
$47$1,880$3,760$8,146.67$97,760
$48$1,920$3,840$8,320$99,840
$49$1,960$3,920$8,493.33$101,920
$50$2,000$4,000$8,666.67$104,000
$55$2,200$4,400$9,533.33$114,400
$60$2,400$4,800$10,400$124,800
$65$2,600$5,200$11,266.67$135,200
$70$2,800$5,600$12,133.33$145,600
$75$3,000$6,000$13,000$156,000
$80$3,200$6,400$13,866.67$166,400
$85$3,400$6,800$14,733.33$176,800
$90$3,600$7,200$15,600$187,200
$95$3,800$7,600$16,466.67$197,600
$100$4,000$8,000$17,333.33$208,000

employeecalculators.com/charts/hourly-to-salary-chart/ · Gross amounts before taxes and deductions, rounded to the cent.

How to read the chart

Find the hourly rate in the first column. At $20 an hour, a full-time year is $41,600.00, or $1,600.00 every two weeks and $3,466.67 a month. A quick shortcut: double the hourly rate and add three zeros for a rough yearly figure ($20 → about $40,000). The chart's exact 2,080-hour figure is a little higher.

What the chart assumes

  • 40 hours every week and 52 paid weeks. Unpaid time off, part-time hours, or a 37.5-hour week lower the yearly total. The hourly to salary calculator handles any schedule.
  • No overtime. Hours over 40 in a workweek are usually paid at time and a half; see the overtime rate chart.
  • Gross pay. Taxes, insurance, and retirement deductions come out of these amounts. See gross pay vs net pay.
  • Even pay periods. A biweekly year can have 27 paydays instead of 26 depending on the calendar; the chart divides the annual amount by 26.

For any value that is not on the chart, use the hourly to salary calculator. The guide explains the math step by step.

How this chart was made. Every value is computed by the same tested formulas as our calculators; nothing is typed by hand. Read our methodology and disclaimer.

Last updated: