Salary to Hourly Chart

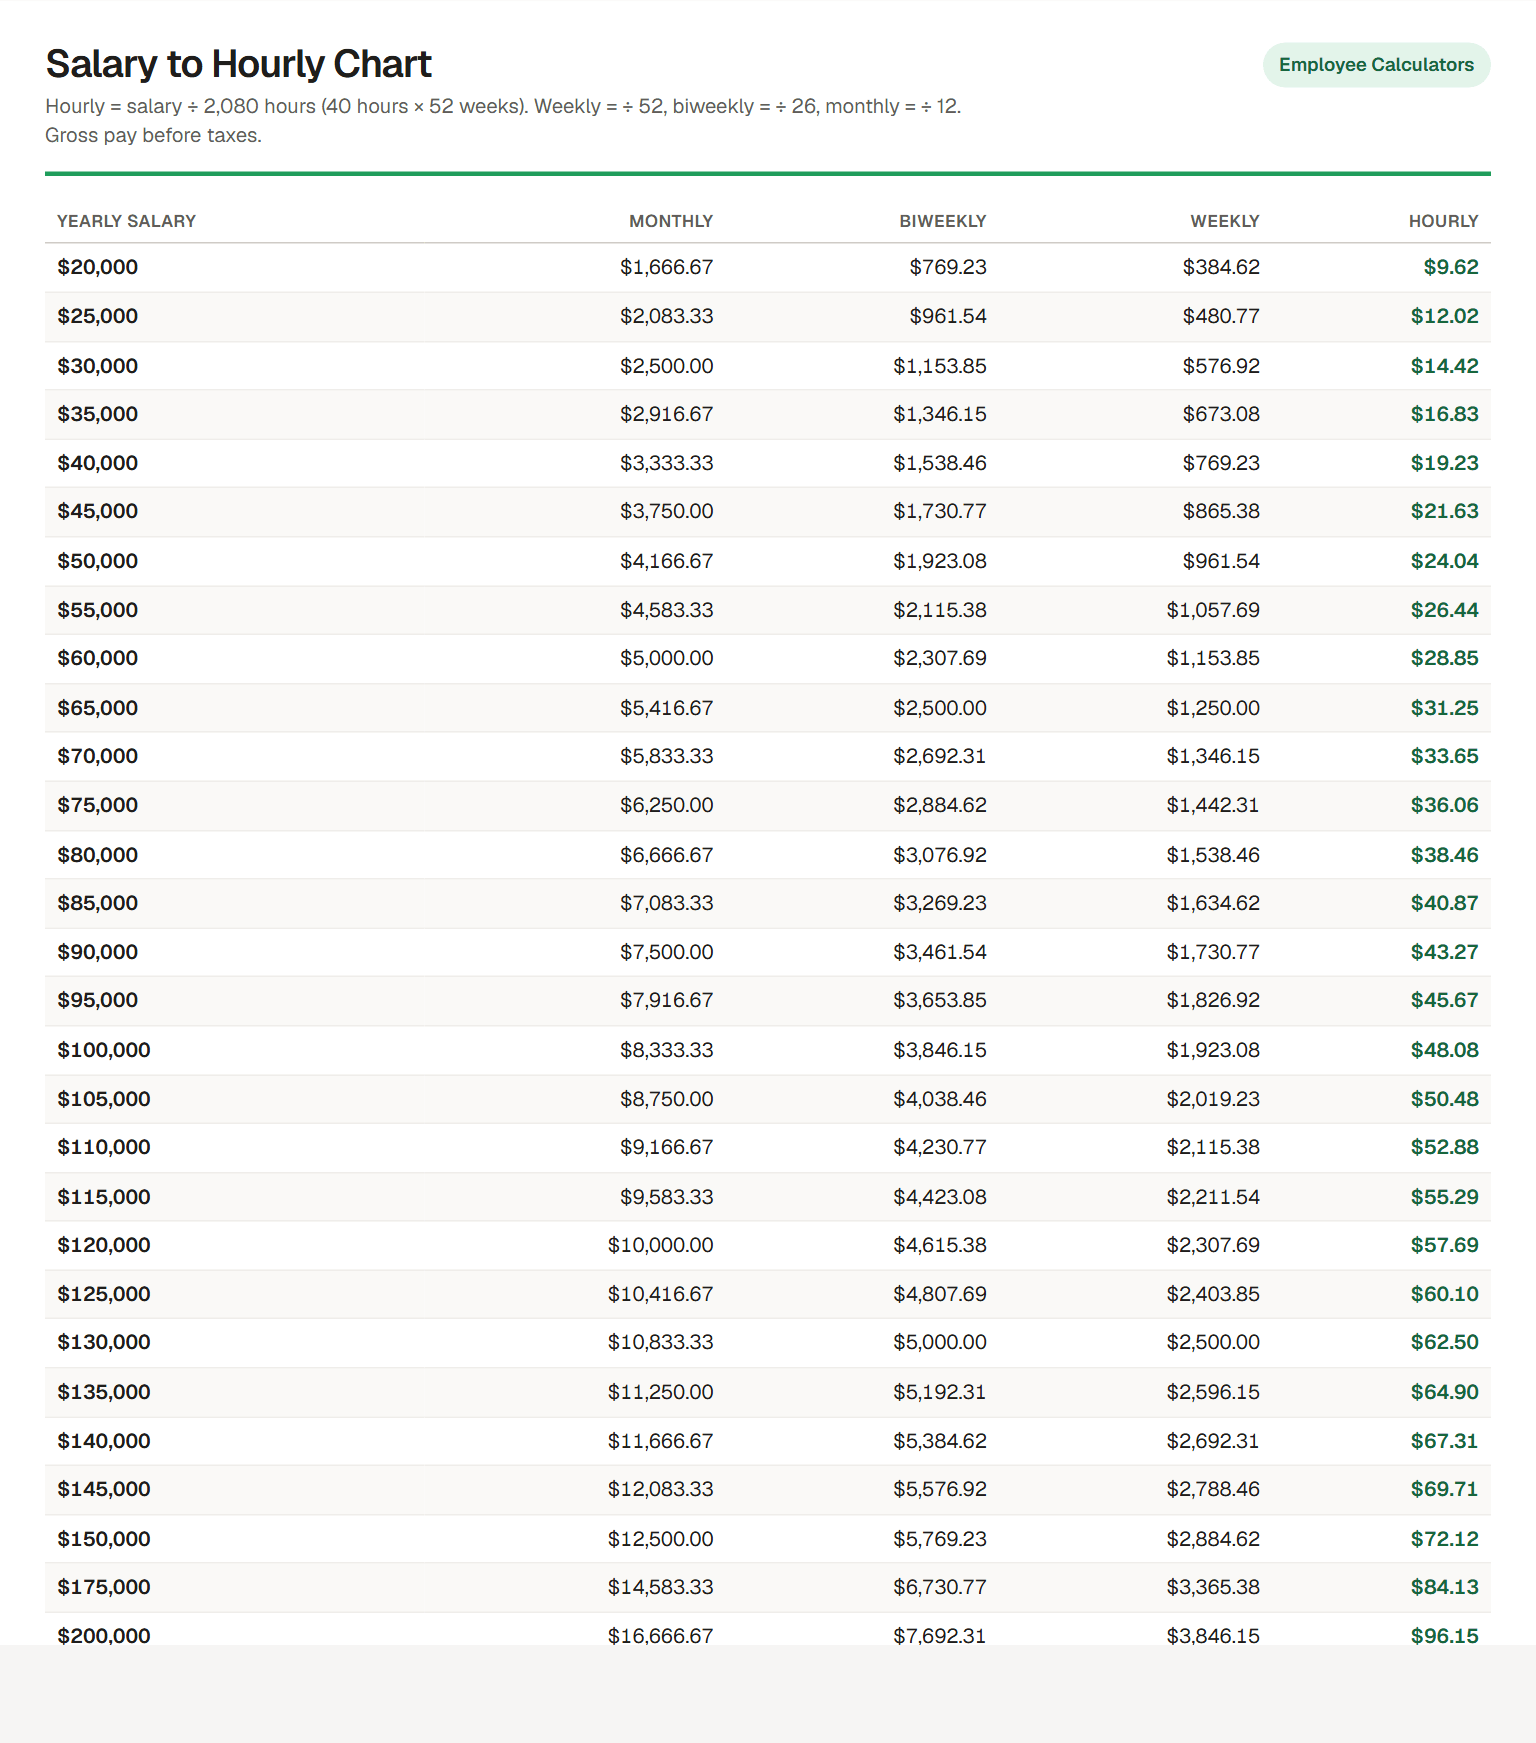
Annual salaries from $20,000 to $200,000 converted to hourly, weekly, biweekly, and monthly gross pay. Useful for comparing a salaried offer with an hourly job.

Salary to Hourly Chart

Hourly = salary ÷ 2,080 hours (40 hours × 52 weeks). Weekly = ÷ 52, biweekly = ÷ 26, monthly = ÷ 12. Gross pay before taxes.

Employee Calculators
Yearly salaryMonthlyBiweeklyWeeklyHourly
$20,000$1,666.67$769.23$384.62$9.62
$25,000$2,083.33$961.54$480.77$12.02
$30,000$2,500.00$1,153.85$576.92$14.42
$35,000$2,916.67$1,346.15$673.08$16.83
$40,000$3,333.33$1,538.46$769.23$19.23
$45,000$3,750.00$1,730.77$865.38$21.63
$50,000$4,166.67$1,923.08$961.54$24.04
$55,000$4,583.33$2,115.38$1,057.69$26.44
$60,000$5,000.00$2,307.69$1,153.85$28.85
$65,000$5,416.67$2,500.00$1,250.00$31.25
$70,000$5,833.33$2,692.31$1,346.15$33.65
$75,000$6,250.00$2,884.62$1,442.31$36.06
$80,000$6,666.67$3,076.92$1,538.46$38.46
$85,000$7,083.33$3,269.23$1,634.62$40.87
$90,000$7,500.00$3,461.54$1,730.77$43.27
$95,000$7,916.67$3,653.85$1,826.92$45.67
$100,000$8,333.33$3,846.15$1,923.08$48.08
$105,000$8,750.00$4,038.46$2,019.23$50.48
$110,000$9,166.67$4,230.77$2,115.38$52.88
$115,000$9,583.33$4,423.08$2,211.54$55.29
$120,000$10,000.00$4,615.38$2,307.69$57.69
$125,000$10,416.67$4,807.69$2,403.85$60.10
$130,000$10,833.33$5,000.00$2,500.00$62.50
$135,000$11,250.00$5,192.31$2,596.15$64.90
$140,000$11,666.67$5,384.62$2,692.31$67.31
$145,000$12,083.33$5,576.92$2,788.46$69.71
$150,000$12,500.00$5,769.23$2,884.62$72.12
$175,000$14,583.33$6,730.77$3,365.38$84.13
$200,000$16,666.67$7,692.31$3,846.15$96.15

employeecalculators.com/charts/salary-to-hourly-chart/ · Gross amounts before taxes and deductions, rounded to the cent.

How to read the chart

Find the salary in the first column and read across. A $50,000 salary works out to $24.04 an hour for a 40-hour week, $1,923.08 every two weeks, and $4,166.67 a month.

Your real hourly rate

A salary pays the same whether you work 40 hours or 50. If a $50,000 job needs 45 hours a week, the real rate is $50,000 ÷ (45 × 52) = $21.37 an hour, not $24.04. Enter your actual hours in the salary to hourly calculator, or compare two offers with the job offer comparison calculator.

Why 2,080 hours?

52 weeks × 40 hours = 2,080 hours, the divisor most employers use. The federal government uses 2,087 hours, the average number of paid hours in a year over a 28-year cycle (OPM). With 2,087 hours the hourly rate is slightly lower.

For any value that is not on the chart, use the salary to hourly calculator. The guide explains the math step by step.

How this chart was made. Every value is computed by the same tested formulas as our calculators; nothing is typed by hand. Read our methodology and disclaimer.

Last updated: